Advanced topics
Prof. Dr. Stefan Sobernig
November 23, 2021
- Basic analysis of algorithms: The Big O
- Visualizations for Data Science:
- Picking the "right" visualization
- Tooling primer: matplotlib, pandas
- (Library support):
- High-level libraries: pandas (cont'd)
- Low-level libraries: numpy, scipy
- Plotting (cont'd): seaborn, bokeh
- Parsing
Slides: This unit is also available in a PDF format and as a single HTML Page
Readings:
Analysis of algorithms (1)
- We encountered many different computational procedures (algorithms) for different purposes in data processing throughout Units 1 to 5, e.g.:
- Data filtering
- Data sorting
- Data sampling
- Deduplication (blocking, windowing)
- Why do we want to describe the complexity of these procedures (or, the underlying algorithms)?
- How can we describe the their complexity: space vs. time complexity?
Analysis of algorithms (2)
- Studying the complexity of a computation (procedure, algorithm)
involves quantifying and describing ...
- ... the difficulty of solving a computational problem (e.g., sorting)
- ... in terms of the required computational resources:
- running time of a computation
- memory ("space") consumed by a computation
- Note: There can be a fundamental trade-off between running time
and memory consumption.
- Our take: Time complexity of basic opterations in (Python) data
processing.
Analysis of algorithms (3)
- How fast does the (running/ execution) time required by an operation
grow as the size of the problem increases in the worst case?
- "Size of a problem" (\( n \)), eg.: number of elements in a list or array,
number of rows in a table or DataFrame.
- "time required" (\( f \)): a function of N, i.e., \( f(n) \)
- When this function \( f(n) \) grows rapidly, an operation (algorithm) will
become unusable the larger \( n \).
- When this function \( f(n) \) grows "slowly, an operation (algorithm) will
remain usable even at larger \( n \).
Question.
What would you consider "rapidly", "slowly"?
Analysis of algorithms (4): Types of growth
Commonly found types of time growth for some input n:
- \( f(n) = 1 \): Time required is constant, independent of \( n \) (e.g., hash searching).
- \( f(n) = log(n) \): increasing n by a factor \( c \), e.g., doubling \( n \)
increases the required time by a constant amount, i.e. logarithmic
(example: binary search).
- \( f(n) = n \): Required time grows linearly with problem size (linear search in \( n \)-element list)
- \( f(n) = n * log(n) \): Doubling \( n \) increases the required time by more than a double (merge sort, Python's timsort).
- \( f(n) = n^2 \), \( f(n) = n^3 \): quadratic, cubic, etc. Doubling \( n \) results in a four-/ eight-fold increase in the required time (simple sorting, matrix multiplication)
- \( f(n) = c^n \): Doubling the problem size squares the time required, a.k.a. exponential growth).
Analysis of algorithms (5): Big O(rder) notation
- Often, when planning data-processing steps, we want to compare
two or available operations (e.g., search strategies).
- Objective: Comparison based on their relative time complexities or
growth rates: \( f(n) \) vs. \( g(n) \).
- "Strictness" of comparison, e.g., "equal or less than", "same as".
- Big O(rder): \(g \in O(f)\) iff \( |g(x)| \) is smaller than some constant
multiple of \( |f(x)| \) (i.e., \( f \) is of smaller or equal order than
\( g \)).
- Example: \( n^2 \) vs. \( (n^2 + 2n + 3) \) vs. \( 2n \)
Analysis of algorithms (6): Big O(rder) notation
Analysis of algorithms (7): Urban Audit example
Question.
How could we sort it by a different column?
e.g., how could we sort countries by population?
Let's look at the excerpts from the following notebook
haystack = [('BE', 10839905),
 ('BG', 7563710),
 ('CZ', 10532770),
 ('DE', 81802257),
 ('EE', 1365275),
 ('ES', 47021031),
 ('FR', 64611814),
 ('IT', 60340328),
 ('CY', 819100),
 ('HU', 10014324),
 ('NL', 16574989),
 ('PL', 38529866),
 ('PT', 10573479),
 ('RO', 22480599),
 ('SK', 5435273),
 ('FI', 5351427),
 ('SE', 9415570),
 ('NO', 4858199),
 ('CH', 7877571)]
haystack.sort() # by country code
haystack.sort(key=lambda x:x[1]) # by population count
Analysis of algorithms (8): Urban Audit (cont'd)
Note: if you know that a file is sorted, then searching in that file becomes easier/cheaper!
Question.
- "Find me a country with a population above 5000000 people?"‚
- What is the growth rate of the quickest searching algorithm you can think of?
- What if you have the cities and populations already in a sorted list?
- Answer: \( O(\log{}n) \)
- Why?
- Answer: Binary Search!
Bottomline: (pre-)sorting can be costly, but might speed up other
operations... another example: grouping!
Analysis of algorithms (9): Urban Audit example
# Search for first entry bigger than number in a sorted
# list of lists of length 2:
def binary_search(number, array, lo, hi):

    if hi < lo: return array[lo]       # no more numbers
    mid = (lo + hi) // 2               # midpoint in array
    if number == array[mid][0]:
        return array[mid]              # number found here
    elif number < array[mid][0]:
        # try left of here
        return binary_search(number, array, lo, mid - 1)
    else:
        # try above here
        return binary_search(number, array, mid + 1, hi)

# Sample call: Find me a country with a pop. > 5m people?
binary_search(5000000, haystack, 0, len(haystack))
Analysis of algorithms (10): Outlook
- Python's
sort applies Timsort: \( O(n\log{}n) \) (worst case).
- Custom algorithmic recipes for Python 3 (incl. sorting algorithms): http://python3.codes/.
- Sampling: probability-based sampling (pandas)
- Deduplication: total complexity of naive algorithm: \( O(n^2) \) (pairwise comparison). Possible improvements:
- Blocking: \( O(n(n/b + \log{}n)) \) with block size \( b < n \)
- Windowing: \( O(n(w + \log{}n)) \) with window size \( w < n \)
- Sorting+Scan: \( O(n * \log{}n + n) \)
Visualization (1)
- Visualizations
- can support a number of data-processing activities (before analysis!);
- can be used to deliver analysis results;
- See Chapter 3 of "Data Science from Scratch":
- matplotlib
- pandas wrapper around matplotlib
- Notebook
- Corresponding code examples:
- matplotlib: GitHub.
- pandas: "Visualization tutorial":""
- Advanced use of visualizations, such as graphical inference, beyond the scope of this course.
Visualization (2)
- Tasks supported by visualisations:
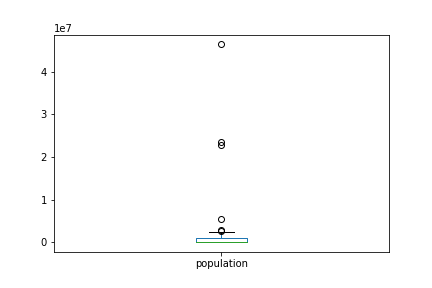
- Anomaly detection: data outliers;
- Grouping: Forming and characterising aggregates of similar data points;
- Finding association (correlation) between pairs of variables;
- Computing derivatives (e.g., sums) of data points;
- Finding extremes, ranges, and orders (rankings) in data points;
- Filtering data points (e.g., for ranges);
- Retrieval of selected data points;
- (Describing data distributions;)
Visualization (3)
- Which visualization type is most effective for a given task?
- Accuracy
- Performance time
- Personal preferences
- No One Size Fits All!
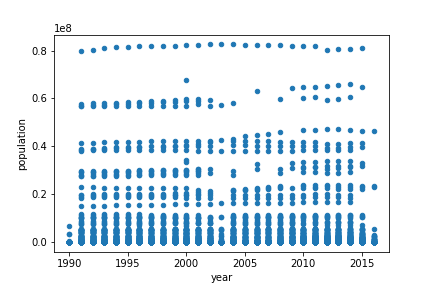
Visualization (4a): Scatterplot

Visualization (4b): Scatterplot

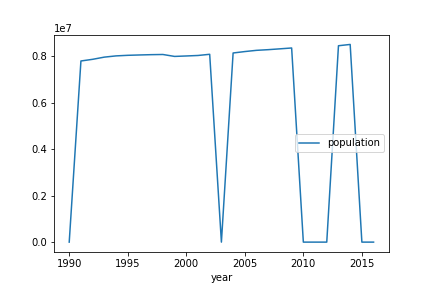
Visualization (5a): Lineplot

Visualization (5b): Lineplot

Visualization (6a): Barplot

Visualization (6b): Barplot

Visualization (7): Boxplot

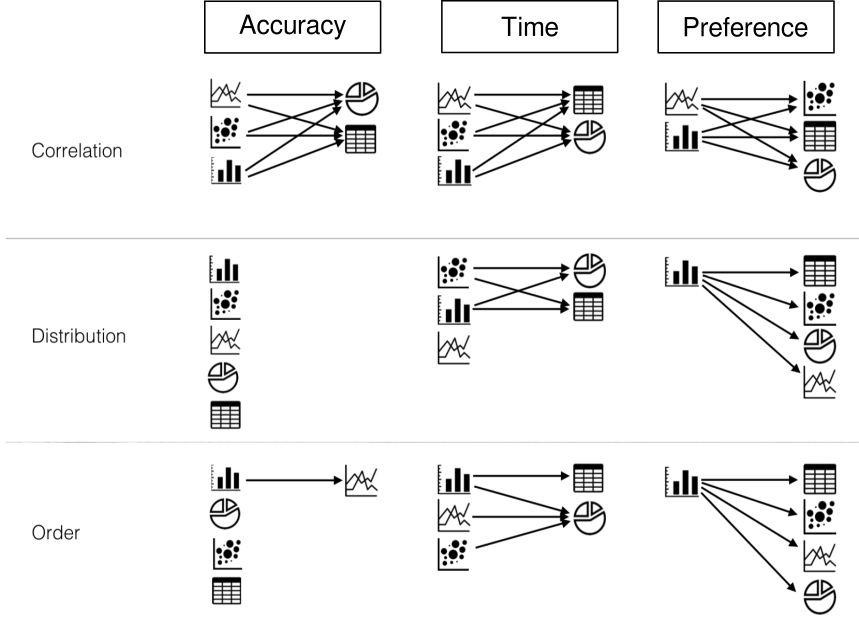
Visualization (8): Task-based effectiveness

Visualization (9)
- Dos:
- Finding groups: Use bar charts (preference bias towards pie charts!)
- Finding associations and trends: Use line plots and scatterplots (preference bias towards line plots!)
- Finding anomalies: Use scatterplots
- Donts:
- Finding groups: Avoid line charts;
- Compute derivatives: Avoid line charts;
- Finding associations and trends: Avoid tables and pie charts;
High-level libraries
- Agate: agate is a Python data analysis library that is optimized for humans instead of machines. It is an alternative to numpy and pandas that solves real-world problems with readable code.
- Pandas: pandas is an open source, BSD-licensed library providing high-performance, easy-to-use data structures and data analysis tools for the Python programming language.
Pandas
import pandas as pd
contains high-level data structures and tools designed to make data analysis fast and easy. Pandas are built on top of NumPy, and makes it easy to use in NumPy-centric applications.
Pandas is well suited for many different kinds of data:
- Tabular data with heterogeneously-typed columns
- Ordered and unordered (not necessarily fixed-frequency) time series data.
- Arbitrary matrix data (homogeneously typed or heterogeneous) with row and column labels
- Any other form of observational / statistical data sets. The data actually need not be labeled at all to be placed into a pandas data structure
Pandas features (1/2)
Here are just a few of the things that pandas does well:
- Handling of missing data
- Adding and deleting columns_ on the fly
- data alignment: objects can be explicitly aligned to a set of labels/columns
- Group by functionality and apply split-apply-combine operations on data sets to aggregate and transform data
- label-based slicing, no need for indices
- Merging and joining
Pandas features (2/2)
- Reshaping
- Hierarchical labels
- Loading data from flat files (CSV and delimited), Excel files, databases, and saving / loading data from the ultrafast HDF5 format
- Time series-specific functionality: date range generation and frequency conversion, moving window statistics, moving window linear regressions, date shifting and lagging, etc.
- plotting support. e.g. see the official tutorial
Pandas: Some more words
It takes a while to get used to pandas. The documentation is exhaustive and there exists hundreds of tutorials and use cases
Some hands on
Checkout the notebook pandas.ipynb
Low-level libraries
- Chardet: Character encoding auto-detection in Python. As smart as your browser. Open source.
- dateutils: The dateutil module provides powerful extensions to the standard datetime module, available in Python.
- Csvkit: csvkit is a suite of command-line tools for converting to and working with CSV, the king of tabular file formats
- Numpy the fundamental package for scientific computing with Python
- SciPy is open-source software for mathematics, science, and engineering
Numpy
import numpy as np
Numpy the fundamental package for scientific computing with Python. It contains among other things:
- a powerful N-dimensional array object
- sophisticated (broadcasting) functions
- tools for integrating C/C++ and Fortran code
- useful linear algebra, Fourier transform, and random number capabilities
Check out this tutorial or this one (includes also scipy and matplotlib)
NumPy does not provide high-level data analysis functionality, having an understanding of NumPy arrays and array-oriented computing will help you use tools like Pandas much more effectively.
SciPy
SciPy is open-source software for mathematics, science, and engineering
The SciPy library depends on NumPy, which provides convenient and fast N-dimensional array manipulation. The SciPy library is built to work with NumPy arrays, and provides many user-friendly and efficient numerical routines , such as routines for numerical integration and optimization.
SciPy subpackages (1/2)
- cluster: Clustering algorithms
- constants: Physical and mathematical constants
- fftpack Fast Fourier Transform routines
- integrate Integration and ordinary differential equation solvers
- interpolate Interpolation and smoothing splines
- linalg Linear algebra
- ndimage N-dimensional image processing
SciPy subpackages (2/2)
- odr Orthogonal distance regression
- optimize Optimization and root-finding routines
- signal Signal processing
- sparse Sparse matrices and associated routines
- spatial Spatial data structures and algorithms
- special Special functions
- stats Statistical distributions and functions
from scipy import linalg, optimize
SciPy
Again, check out the official tutorials
Some examples:
Plotting
Plotting
There exists many libraries for plotting:
- matplotlib: Python's most popular and comprehensive plotting library that is especially useful in combination with NumPy/SciPy.
- seaborn: extension for matplotlib with enchanced visual styles and additional plots
- qqplot ( like qqplot2 in R)
- bokeh: Bokeh is a plottling library for interactive plots typically viewed in Web applications
- folium leaflets
Machine learning?
Machine learning
- scikit-learn builds on NumPy and SciPy, including clustering, regression, and classification, well documented, many tutorials and examplesUsed by data-heavy startups, including Evernote, OKCupid, Spotify, and Birchbox.
- Theano Theano is a Python library that allows you to define, optimize, and evaluate mathematical expressions involving multi-dimensional arrays efficiently. Theano features:
- TensorFlow developed by Google, is an open source software library for numerical computation using data flow graphs. It can be used for deep learning scenarios. Check out their Python API
- Keras: Keras is a high-level neural networks API, written in Python and capable of running on top of either TensorFlow or Theano. It was developed with a focus on enabling fast experimentation. Being able to go from idea to result with the least possible delay is key to doing good research.
Data Mining & NLP
Data Mining & NLP
- Scrapy an open source and collaborative framework for extracting the data you need from websites. In a fast, simple, yet extensible way.
- NLTK NLTK is a leading platform for building Python programs to work with human language data. It provides easy-to-use interfaces to over 50 corpora and lexical resources such as WordNet, along with a suite of text processing libraries for classification, tokenization, stemming, tagging, parsing, and semantic reasoning and wrappers for industrial-strength NLP libraries.
References
- Chapter 3, Data Science from Scatch
- Reingold (2014): "Basic Techniques for Design and Analysis of Algorithms", Chapter 4, In: Computing Handbook, CRC Press.
- B. Saket, A. Endert and Ç. Demiralp (2019), "Task-Based Effectiveness of Basic Visualizations," in IEEE Transactions on Visualization and Computer Graphics, vol. 25, no. 7, pp. 2505-2512, DOI: 10.1109/TVCG.2018.2829750


